← Back to Main
Data Vis and System Parametrisation
4/15/2025, 5:57:58 AM | Jeanyoon Choi
Original Notes (Pre-LLM)
Data visualisation does not have to be the data vis that we know—it does not have to be graphs, plots, or diagrams → IT can be more. It can be something else, something more like a map, some kind of new structure, new aesthetic, new system -- Now data can be applied as system parameterisation.
Multiple stages of system data vis
1. Data brutalism: No over-designed layer
2. Data visualisation: Charts, Graphs, or sometimes 2D/3D Data vis
3. Dashboard: Combination of visualisation - designed somehow. Somehow an elementary system.
4. WorldBuilding: Decorative. Ian Cheng/Teamlab-like. Unity/Unreal visuals…
5. System Parameterisation: Web/Software based: (System) = f(param1, param2, param3, ..) all visual/audio output composed as the collage of these different parameters. When one dimension of the parameter is changed - either the whole visual, the part of the visual, the context of the visual, the style of the visual, the layout-composition of the visual is changed. Sort of like metaphor from VAE disentanglement but more direct/customised-for-situation/explicit approach.
All algorithmic output is eventually a sort of a data visualisation
-----
Object: Now automatically easily generated (website and stuffs)
Key: Object - not only generate - but mass generate (even further) - key to this is modularisation and retrieval of key parameters
Back then what was random parameters - only colors or hex cods or smth that can be explicitly parameterised/numerically transformed
Now: for the context, thx for llm, all-natural languages can be modularised and mass-produced
So whatever you build - look for a systematic pov, not as a slave of the system, but the creator/manager of the system, make it as a combination of parameters, a combination of data – and thus you can massively create different systems (which generate objects), when other just focus on mass generating objects on their own
COLORS, MINOR SIZES RANDOM/ADJUSTED → ALL PARAMETERS RANDOM/ADJUSTED
----
Gpt-4o: Image generation. Very good.
All Images, Videos generation are telling me: Lots of static stuffs can now be auto-generated.
BUT this is not dynamic, this is not interactive - This is not a system.
Objects are easily generated, and static objects are also easily generated. However, interactive objects—a system that defines the result of these interacted results—cannot be generated. Now we should focus on creating these systems. Systems which operate on top of parameters, and user adjusts -- and the parameters (some numeric, some contextual) redefine and reshape the system.
“FROM OBJECT TO SYSTEM”
--
SYSTEM: Dynamic system? Ecological system?
For example, within an ecological system art, the user interaction (i.e. difference in system parameters) might effect
The small part of the visual (unit visual)
The overall small degree
The style of the visual -- Minroily, Majorily -- JUST DIFFERENTIATING THE WHOLE STYLE (pretty much metaphor from style transfer)
The composition of the visual / The layout of the visual
The signified description of the visual
The image used in the visual
The temperature of the system
Other different ecological parameters of the system
Each temperature of each system
And the change in the ultimate ‘status’ ‘state’ of the system - in this case, the temperature - might affect ALL visual’s status, style, specs, texts, and graphs.
Collage - Parameterising Basquiat?
Here, for example:
The subsection might be a graph. The graph itself might change, as well as the presentation of the graph (style, animation) accordingly
The partial image might change - real-time generation? Getting image from real-world?
Obviously the composition/layer might change. In the course of this change, the asset that’s used might also change.
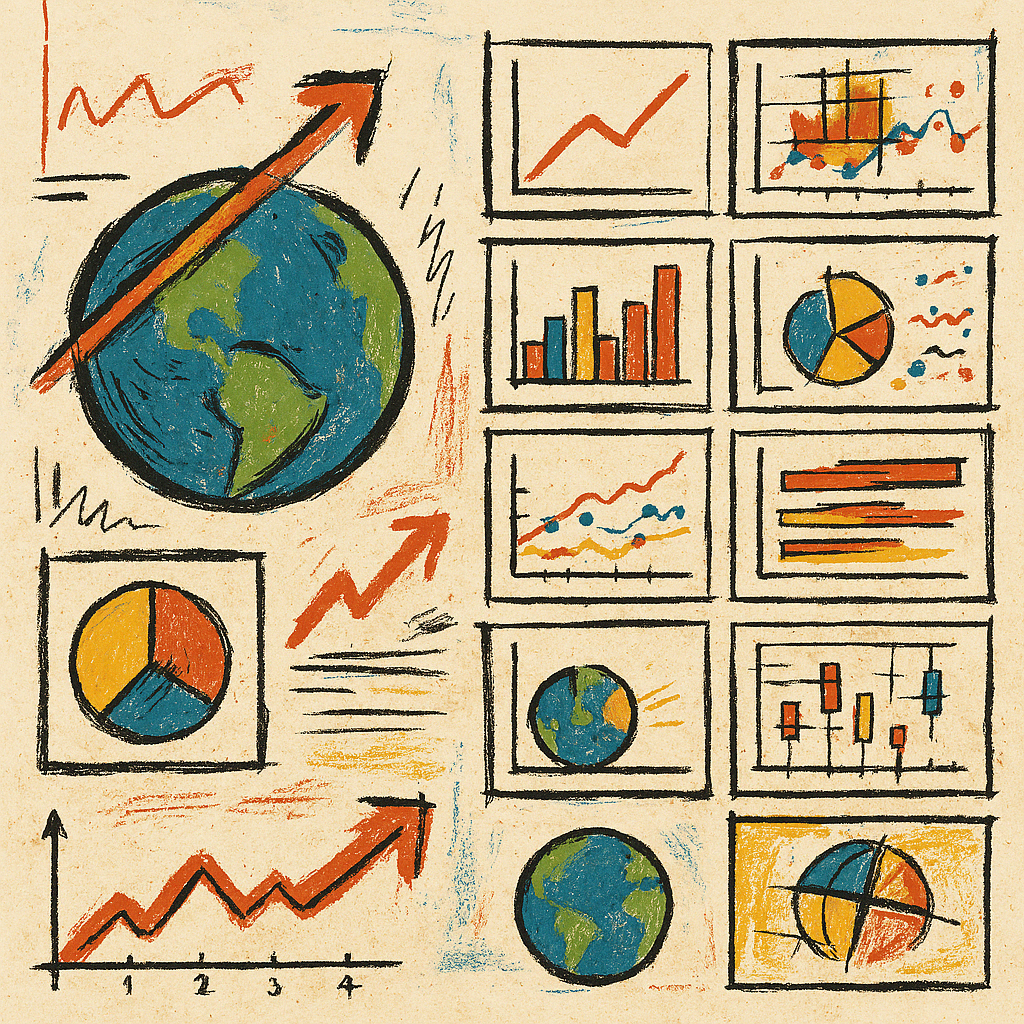
Or the overall theme might change! From Basquiat to more childish (minor adjustment), from basquiat street-style to minimalistic conventional media art style (major adjustment)
The ingredients are the same: Globe visual on the left, 16 charts on the right
But as the theme change: the visual output drastically changes.
From minimalist neon-ish data visualisation aesthetic, to chaotic basquiat-like street style data visualisation.
Or the overall composition might blink: Showing on/off, turning on/off
Other strategies to well-communicate the changing in data - but not explicitly, not using graphs, but more implicitly? Via other parameters? Any idea?
----
Another automatic system: The ideal automatic system is self-evolving, self-generative, and self-calculating. Here, the parameter might play smth more than merely adjusting the visuals: Its parameter is a meta-parameter for the parameter that’s shown on the visual, adjusting the visual, but not directly accessible. Think of: 지수들. Poission Lambda, for example.
-------
The aesthetic of automatic system (and apramter-based system): 개미들아 일하게 하여라! 개미 한명 한명이 일하는것을 보여주는것 (Single Agent/Single System Unit) 만으로는 충분하지 않다. 개미 여러명이 한꺼버ㅓㅂㄴ에 분주하게 일하게 하여라. 그리고 그 방향성, 그 일의 objective 응은 우리 인간들이 제공한다. – 그러니 여러 개미들아, 일하여라 (Objection - optmimsation to the objective) – 그 일하는 목적이 무엇인지는 질문하지 말고 (no doubt on the objective), 그냥 열심히 하라면 하여라. 오늘 내가 시키는 일이 내일 내가 시키는 일과 정반대이더라도 (시지프스), 그냥 열심히 일하라.
일종의 현대적인 파리 인종 동물원 – 그러나 이제 모든 인류는 평등하다. 그러나 이것을 인류와 기계가 평등해야한다는 것으로 착각할 필요는 없다. 기계들이여, 일하라. 우리는 양산을 쓰고 그대 기계-개미들이 열심히 일하는 ㄱ성르 고나망하고 있겠다. 우리는 너네 기계들에게 여러 먹거리를 주겠다. 이런 방향서응로 가여라, 저런 방향성으로 가여라. That’s system parameteric adjustment. And system & units gmove/morph accordingly. So they are really good at optimisating withi n the given objective, but not capable of reasoning beyond the given objective.
English Version (LLM-Generated)
Data visualization need not be confined to traditional graphs, plots, or diagrams—it can evolve beyond these familiar forms. Today, data can assume the qualities of a map, a novel structure, an innovative aesthetic, or an entirely new system. In this context, data becomes a tool for system parameterization, enabling new ways to understand and interact with information.
Consider a multi-tiered approach to system-based data visualization:
1. Data Brutalism: This stage prioritizes raw data presentation without additional design layers.
2. Traditional Data Visualization: Here, charts, graphs, and occasionally 2D/3D representations are employed.
3. Dashboards: These combine various visualizations into a cohesive, albeit elementary, system.
4. World Building: Influenced by the likes of Ian Cheng and TeamLab, this stage integrates decorative elements and immersive visual experiences, often using platforms such as Unity or Unreal Engine.
5. System Parameterization: At this level, web and software-based platforms define systems as functions of various parameters (e.g., System = f(param1, param2, param3, ...)). The resulting visual and/or audio output is a composite of these parameters. Adjusting any parameter—whether it affects the entire visual, a component of it, its context, style, or layout—results in customized and situation-specific transformations. This approach is reminiscent of VAE disentanglement but offers a more direct and explicitly adjustable method.
Ultimately, all algorithmic outputs can be interpreted as a form of data visualization.
The contemporary focus shifts from merely generating objects to mass-producing them systematically. Whereas earlier automation could only transform aspects like color codes or simple numerical parameters, today’s advances—bolstered by large language models—enable the modularization and mass production of natural language contexts. This shift emphasizes a systematic perspective: instead of being passive users of pre-defined systems, we as creators and managers can design systems as combinations of parameters and data. Such an approach allows the mass generation of distinct systems that, in turn, generate individual objects, a critical departure from merely mass-producing isolated objects.
Consider the evolution of generative models, such as GPT-4’s image generation capabilities. While impressive in creating static images or videos, these tools do not yet provide the dynamic, interactive systems that define evolving experiences. Easy generation of static objects contrasts sharply with the challenge of creating interactive environments where user-adjusted parameters—numeric or contextual—reshape systems in real time.
The concept of “From Object to System” encapsulates this transformation:
A system is not merely a collection of objects but a dynamic, often ecological, network where user interaction influences multiple aspects of the output. In an ecological art system, for example, varying system parameters can affect:
• The characteristics of individual visual units
• The degree of transformation across the system
• The overall visual style—ranging from minor adjustments to major shifts akin to style transfer
• The layout and composition of elements
• The descriptive metadata of the visual representation
• The specific images or assets used
Moreover, system-wide parameters such as "temperature" or other ecological factors can impact every visual element’s style, specifications, text, and graphics. Imagine a collage where a subsection is a dynamic graph whose style and animation change in real time; or an image that is continuously generated from live data. The overall theme might transition—from a minimalist, neon-inspired data visualization aesthetic to a chaotic, Basquiat-like street style—while the underlying components (for example, a globe on the left paired with multiple charts on the right) remain constant. Ultimately, this systematic adaptation can result in dramatic shifts in composition, such as toggling different layers on and off.
Beyond explicit graph-based communication, alternative strategies for conveying data changes—using implicit parameters—are worth exploring. An ideal automatic system would be self-evolving, self-generative, and self-regulating. In such a system, parameters not only adjust visual displays but also serve as meta-parameters that govern the behavior of other parameters. Consider, for instance, how a Poisson Lambda might indirectly affect visual output without being directly accessible to the user.
The underlying aesthetic of an automatic, parameter-based system can be captured by the notion of collective, distributed work—akin to an industrious swarm of agents. Rather than focusing solely on individual elements, the emphasis is on the coordinated activity of countless units, each executing specific tasks based on overarching human-defined objectives. In this model, both humans and machines contribute to a unified objective, although it is important to note that this collaboration does not imply an equivalence in agency or reasoning capability between the two. Machines excel at optimizing within given constraints but do not possess the capacity for reasoning beyond their defined objectives.
In summary, the transformation from object generation to system development represents a significant paradigm shift in data visualization. By leveraging systematic parameterization, creators can develop dynamic, interactive environments that not only display data but also allow for continuous, adaptive transformation in response to user interactions and evolving parameters.
Korean Version (LLM-Generated)
데이터 시각화는 우리가 전통적으로 인식하는 그래프, 플롯, 다이어그램에 국한되지 않습니다. 데이터 시각화는 지도와 같이 새로운 구조, 독창적인 미학, 또는 전혀 다른 시스템의 형태로 구현될 수 있으며, 데이터는 시스템의 매개변수화(parameterisation)의 한 요소로 적용될 수 있습니다.
다음은 시스템 기반 데이터 시각화의 여러 단계입니다.
1. 데이터 브루탈리즘(Data Brutalism): 불필요한 디자인 장식을 배제한 순수한 데이터 표현.
2. 데이터 시각화(Data Visualization): 차트, 그래프, 또는 2D/3D 형태의 데이터 시각화.
3. 대시보드(Dashboard): 다양한 시각화 요소들이 결합되어 기초적인 시스템을 구성함.
4. 월드빌딩(WorldBuilding): 장식적 요소를 강조하는 단계로, Ian Cheng이나 Teamlab의 접근 방식, 혹은 Unity와 Unreal 엔진을 활용한 비주얼 표현이 해당됨.
5. 시스템 매개변수화(System Parameterisation): 웹 또는 소프트웨어 기반의 시스템에서 (시스템) = f(매개변수1, 매개변수2, 매개변수3, …)와 같이, 다양한 매개변수들이 시각 및 청각 출력의 구성 요소로 융합됩니다. 이 경우, 매개변수 중 하나의 값이 변경되면 전체 시각 요소나 일부, 또는 해당 시각의 배경, 스타일, 구성 방식 등이 변화합니다. 이는 VAE(Variational Autoencoder)에서의 분리(disentanglement)를 은유적으로 표현한 것이지만, 상황에 따라 보다 직접적이고 맞춤화된 명시적 접근 방식이라 할 수 있습니다.
모든 알고리즘 기반 결과물은 결국 일종의 데이터 시각화로 해석될 수 있습니다.
────────────────────────────
최근에는 객체 그 자체를 자동으로, 그리고 대량으로 생성할 수 있는 기술이 발전하였습니다. 과거에는 임의의 매개변수로 색상이나 16진수 코드 등 한정된 요소만을 조절할 수 있었다면, 현재는 자연어 처리 기술(LLM 등)의 발전 덕분에 모든 자연어적 요소가 모듈화되어 대량생산이 가능해졌습니다. 중요한 점은 단순히 객체를 생성하는 데 그치지 않고, 시스템적 관점에서 이를 매개변수들의 조합으로 구성하여 다양한 시스템(즉, 객체를 생성하는 시스템)을 대량으로 창출할 수 있다는 것입니다. 이는 객체의 색상이나 크기 등이 임의로 조정되는 것에서 나아가 모든 매개변수가 랜덤 또는 조절 가능한 형태로 발전함을 의미합니다.
예를 들어, GPT-4 기반 이미지 생성 기술은 정적인 이미지나 동영상 생성에는 뛰어난 성능을 보입니다. 그러나 이러한 정적 생성물은 동적이거나 상호작용하는 시스템이라기보다는, 단순한 객체 생성에 그칩니다. 상호작용 가능한 객체—즉, 사용자와의 상호작용에 따라 그 결과가 재정의되는 시스템—를 생성하는 기술이 요구되고 있으며, 우리는 이제 이러한 시스템의 창출에 집중해야 합니다. 사용자에 의해 조작되는 매개변수(수치적 또는 맥락적 요소)가 시스템의 상태, 스타일, 구성 등을 재정의하고 재구성하는 동적인 시스템이 필요합니다.
"객체에서 시스템으로의 전환"
────────────────────────────
시스템 디자인의 예시를 들어보면, 동적 혹은 생태학적 시스템 내에서 사용자 상호작용(즉, 시스템 매개변수의 변화)이 다음과 같은 요소에 영향을 줄 수 있습니다.
• 개별 시각 단위(유닛 시각)의 요소 변화
• 전체 시각의 미세한 변화
• 시각 스타일의 조정(미세하게 혹은 대폭적으로 변화하여 전체 스타일이 달라짐) – 이는 스타일 전이(style transfer)의 개념과 유사함
• 시각 구성 및 레이아웃의 재배치
• 시각에 부여된 의미와 설명의 변화
• 사용되는 이미지의 변경
또한, 시스템의 온도나 기타 생태학적 매개변수들이 각각의 시스템에 적용되며, 이로 인해 최종 상태나 단계—예를 들어 온도의 변화—가 모든 시각 요소의 상태, 스타일, 규격, 텍스트, 그래프 등에 영향을 미치게 됩니다.
하나의 예시로, 매개변수로 재구성된 바스키아(Basquiat) 스타일의 콜라주를 생각해볼 수 있습니다. 특정 하위 섹션이 그래프로 표현된다고 할 때, 해당 그래프의 형태와 프레젠테이션(스타일, 애니메이션 등)이 매개변수에 따라 실시간으로 변경될 수 있습니다. 부분 이미지 역시 실시간 생성되거나 실제 세계의 이미지를 반영할 수 있으며, 구성이나 레이어 역시 변화할 수 있습니다. 전체 테마 역시 미세한 조정으로는 바스키아의 거리 예술 스타일에서 다소 어린아이의 감성이 느껴지는 스타일로, 또는 극적으로 미니멀한 네온 계열의 데이터 시각화에서 혼돈스러운 바스키아 스타일로 변화할 수 있습니다. 구성 요소는 동일하더라도(예: 좌측의 지구 이미지와 우측의 16개 차트) 테마 전환에 따라 시각 출력은 크게 달라질 수 있으며, 구성 자체가 깜빡이며 활성화·비활성화될 수도 있습니다.
이와 같이 데이터의 변화 표현을 그래프와 같은 명시적인 수단이 아니라, 보다 암시적이고 다양한 매개변수를 통해 전달할 수 있는 전략에 대한 고민이 필요합니다.
────────────────────────────
또 다른 자동화 시스템의 이상적인 형태는 자기 발전, 자기 생성, 자기 계산이 가능한 시스템입니다. 이 경우 매개변수는 단순히 시각 효과를 조절하는 요소를 넘어, 시각에 표시되는 매개변수 자체의 상위 매개변수(meta-parameter) 역할을 수행하여, 간접적으로 시각 효과를 조정하게 됩니다. 예를 들어, 지수나 포아송 분포의 람다(Poisson Lambda)와 같은 개념이 이에 해당할 수 있습니다.
────────────────────────────
자동화 시스템 및 매개변수 기반 시스템의 미학은 단순히 개별 에이전트(또는 시스템 단위)가 독립적으로 작업하는 모습을 넘어, 여러 에이전트가 집단적으로 분주하게 작업하는 과정을 보여주는 데에 있습니다. 각 개별 에이전트가 단순히 역할을 수행하는 것에 그치지 않고, 전체 시스템의 목표(인간이 제공하는 방향성과 목적)에 따라 최적화된 작업 환경을 구축하는 것을 의미합니다. 현대의 파리 인종 동물원과 같이 모든 요소가 평등하게 작업하는 시스템이지만, 여기서 인간과 기계가 반드시 동등하다고 볼 필요는 없습니다. 기계는 주어진 목표하에 효율적으로 작업하도록 설계되고, 우리는 기계에게 다양한 입력(먹거리)을 제공하여 특정 방향으로 시스템을 이끌어야 합니다. 이러한 방식이 바로 시스템의 매개변수적 조정이며, 시스템과 그 구성 단위들은 이에 따라 형태와 기능을 변화시킵니다. 결국 이 시스템들은 주어진 목표 내에서 최적화에 뛰어나지만, 그 목표를 넘어선 추론은 수행하지 못합니다.
이와 같이 데이터 시각화의 영역은 단순히 정적 객체의 생성에서 벗어나, 객체들이 상호작용하며 변화하는 동적 시스템으로 확장되고 있습니다. 향후 연구와 응용에 있어 이러한 시스템 설계가 중요한 역할을 할 것으로 기대됩니다.
Tags
System Art Layouts
Modular Composition
Grid Systems Design
Digital Art Layers
Multi-Device Artworks
Spatial Composition
2D Layout Strategies
3D Layout Exploration
Collage Aesthetics
Chaotic Order
Algorithmic Layout
Generative Composition
Deconstructivist Layouts
Hyperbolic Geometry Art
Emergent Aesthetics
Whole Greater Than Sum
Interactive Layouts
Speculative Interfaces
System Modularity
Visual Organization
Text written by Jeanyoon Choi
Ⓒ Jeanyoon Choi, 2024